
Check a list of URLs every five minutes, email your service desk when one goes down or recovers, and show every service’s status on an internal app page. It’s a trimmed-down version of the uptime monitor in our own test organisation.

Build an uptime monitor: the database, the four workflows, the Status page, the live app and the schedule (1:25).
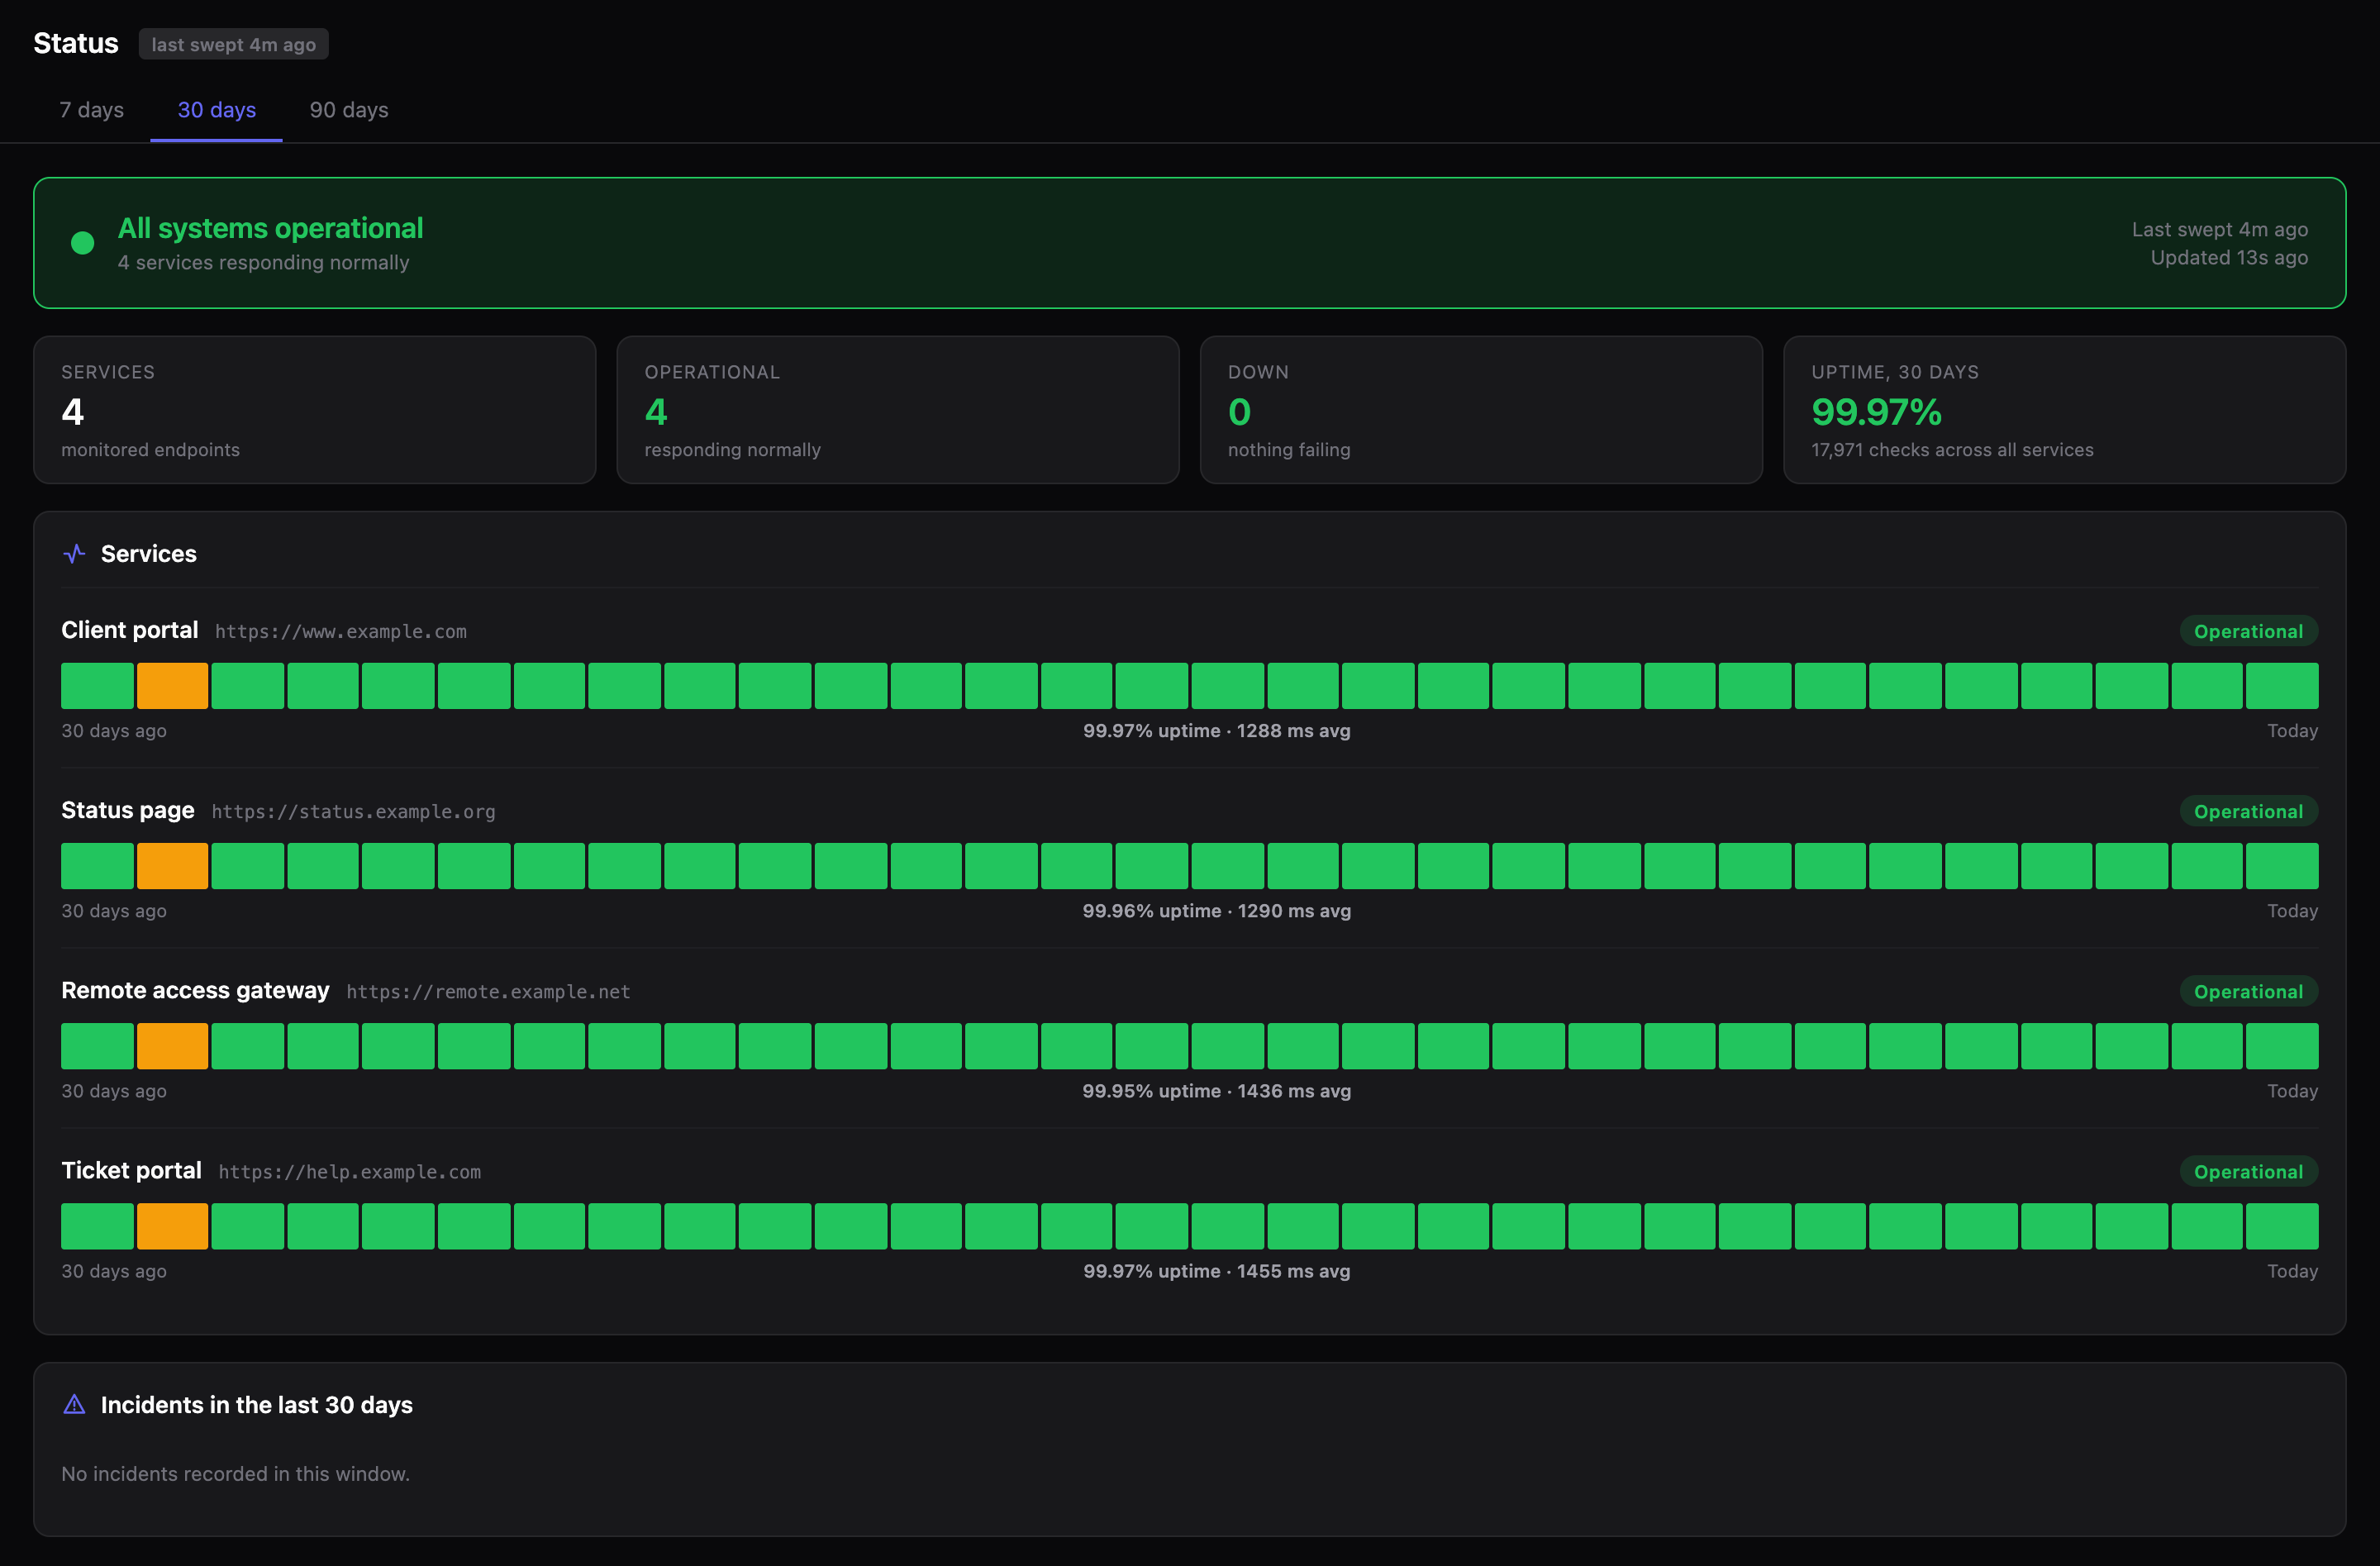
An uptime Status page reading All systems operational, with tiles for 4 services, 4 operational, 0 down and 99.97% uptime over 30 days, and a Services list showing Client portal, Status page, Remote access gateway and Ticket portal with their example.com-style URLs, a 30-day bar of daily results, uptime and average response time, each marked Operational.

The full uptime monitor in our test organisation. The page you build here shows the same services in a simpler table.

You need a PostgreSQL database that Triggr can reach over the internet, with Triggr’s IP addresses allowed through its firewall.

How it works

Dispatch Checks reads the monitors from your database and starts Check Monitor for each one without waiting. Check Monitor runs Probe Endpoint and waits for its answer: a site that doesn’t answer at all fails only the probe’s run, recorded as No response. It then saves the result, marks the monitor down after two failures in a row and emails when it goes down or comes back. The page can’t read your database, so it calls Status through its webhook, and its Check now button starts a sweep with triggr.runWorkflow.

Build it

1

Create the tables

In your database’s own SQL editor, run this, with one uptime_monitors row per site to watch.
2

Connect the database

In Data > Databases, click New Connection > Connection String, paste your connection string and click Create Connection, then click Test Connection on its row (see Databases).
3

Import Uptime - Probe Endpoint

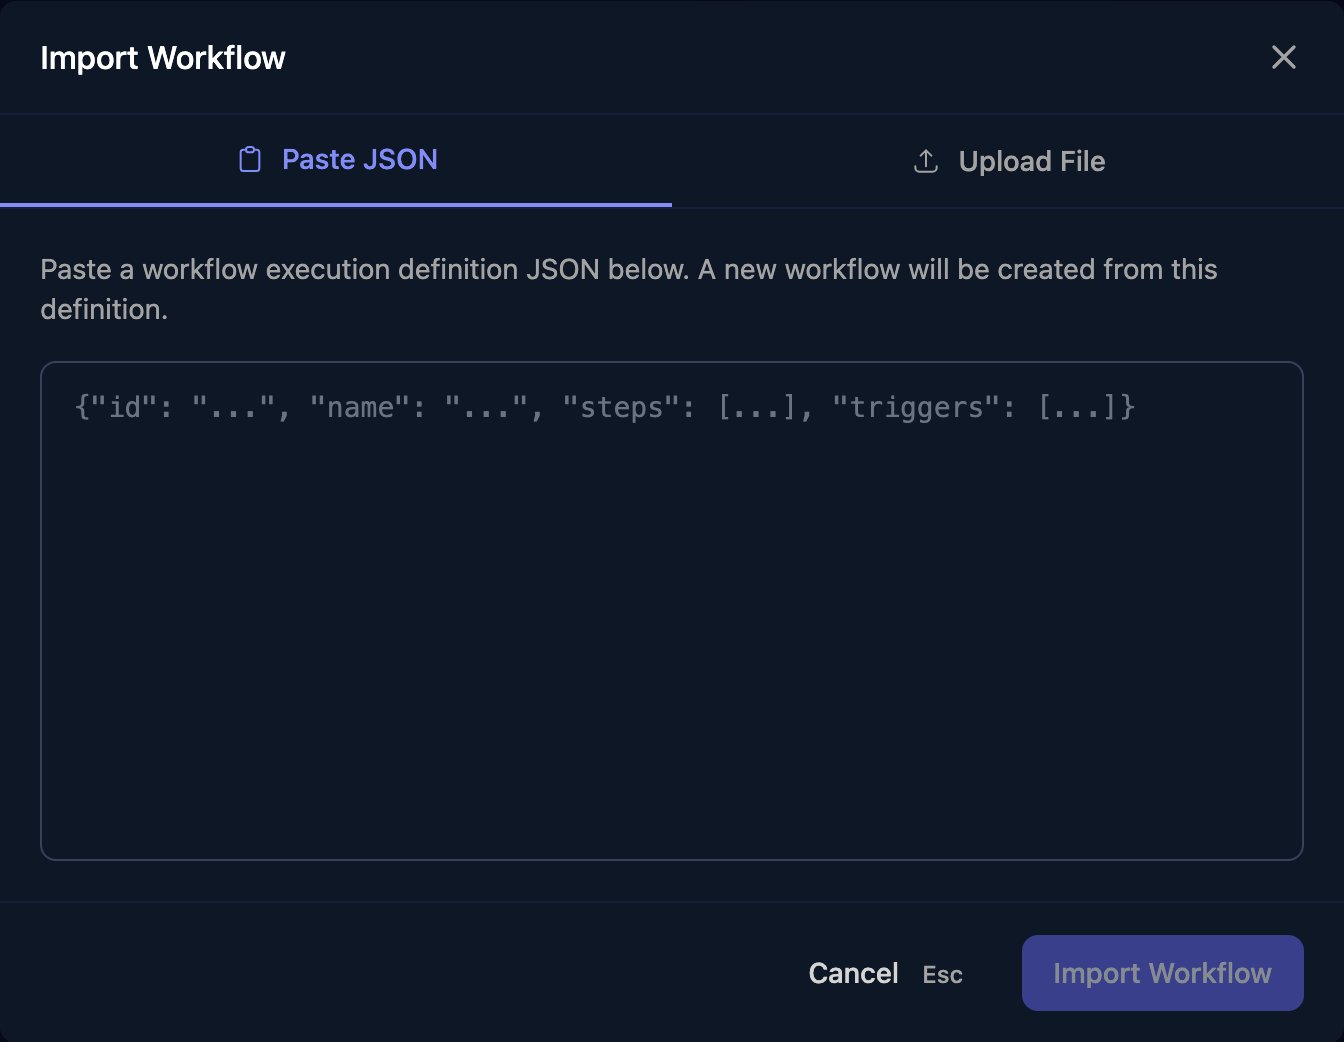
In Workflows, click Import Workflow, paste this and click Import Workflow. It opens in the designer: click Save.
The Import Workflow dialog with Paste JSON and Upload File tabs, an empty box for a workflow execution definition JSON, and Cancel and Import Workflow buttons.
Uptime - Probe Endpoint
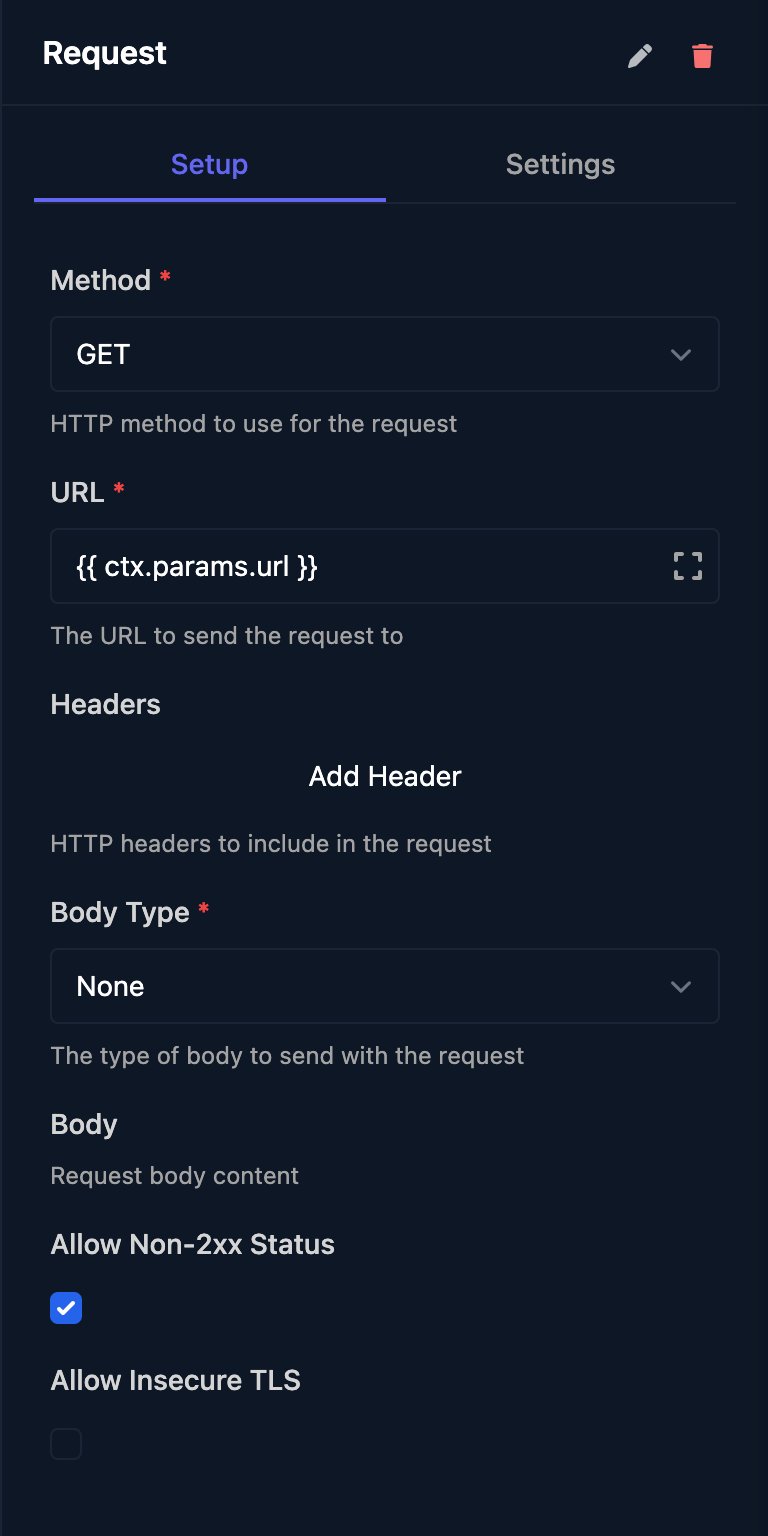
Click Request to see its settings: Allow Non-2xx Status is on, so an error page still counts as an answer, and Finish Workflow returns the HTTP status as its Comment.
The Request step: Method GET, URL set to ctx.params.url, no headers, Body Type None, Allow Non-2xx Status ticked and Allow Insecure TLS unticked.
4

Import Uptime - Check Monitor

Import this the same way.
Uptime - Check Monitor
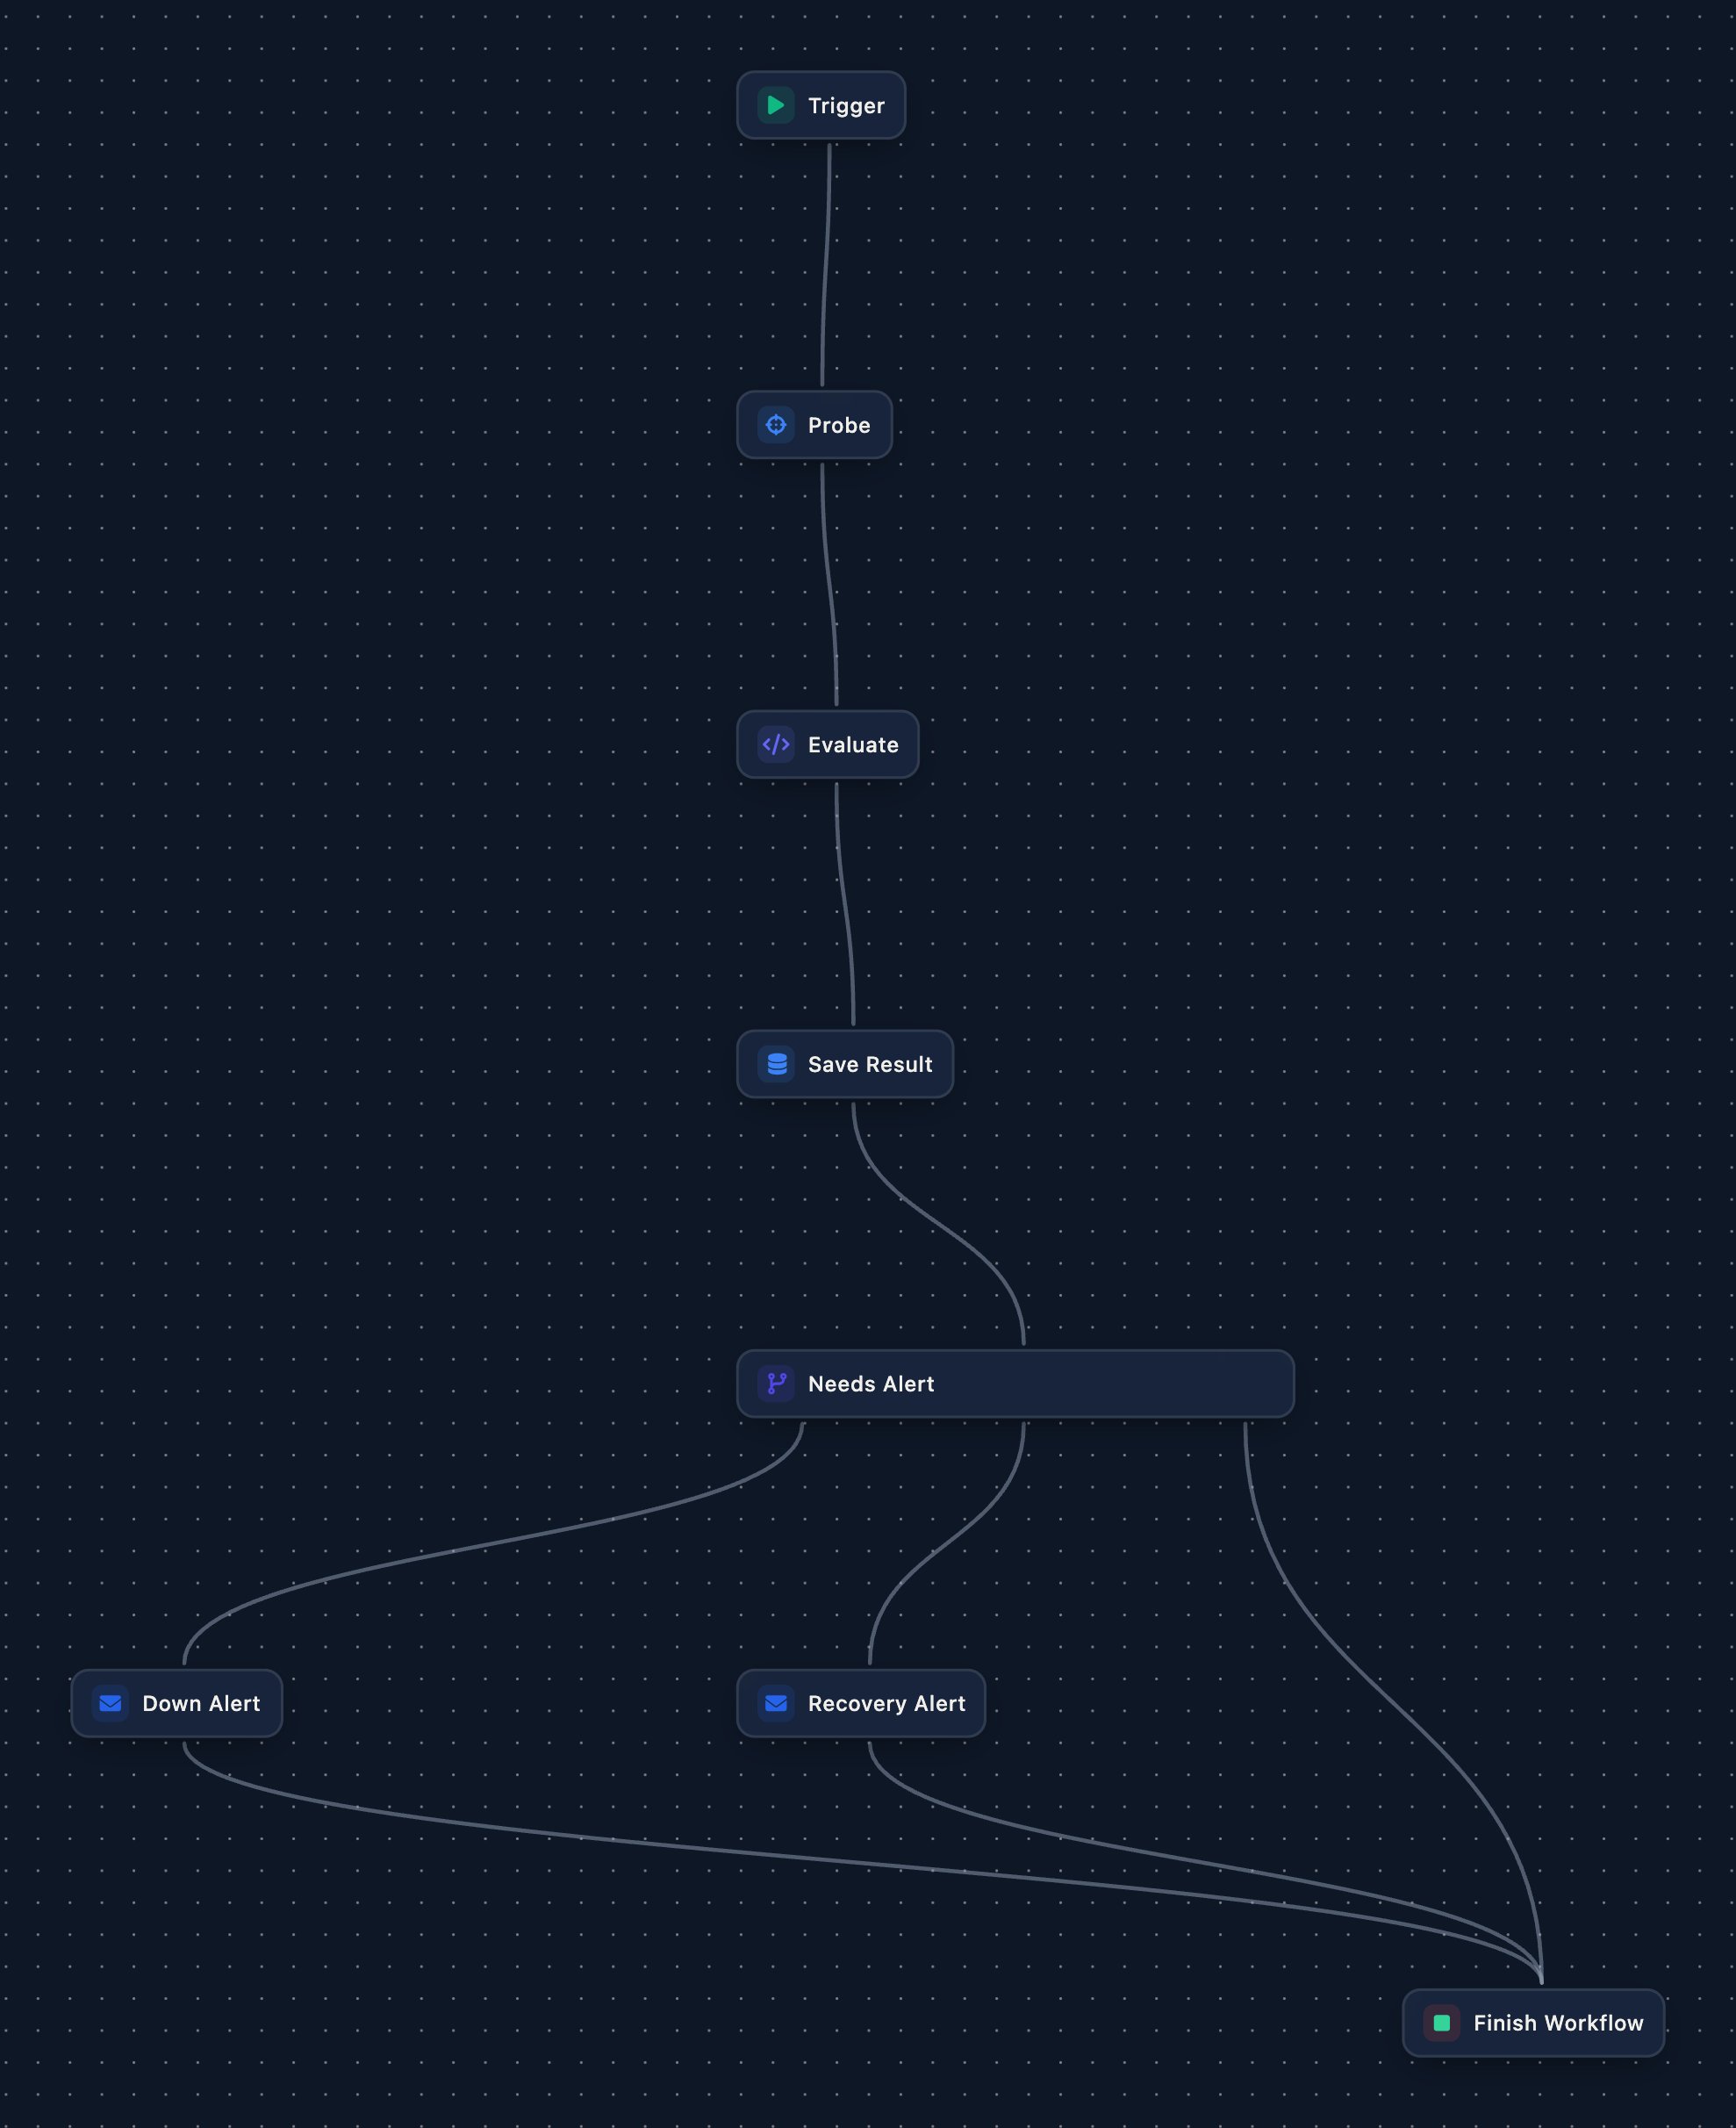
A workflow canvas: Trigger, Probe, Evaluate and Save Result in a line, then Needs Alert branching to Down Alert, Recovery Alert and straight to Finish Workflow.

Uptime - Check Monitor after import.

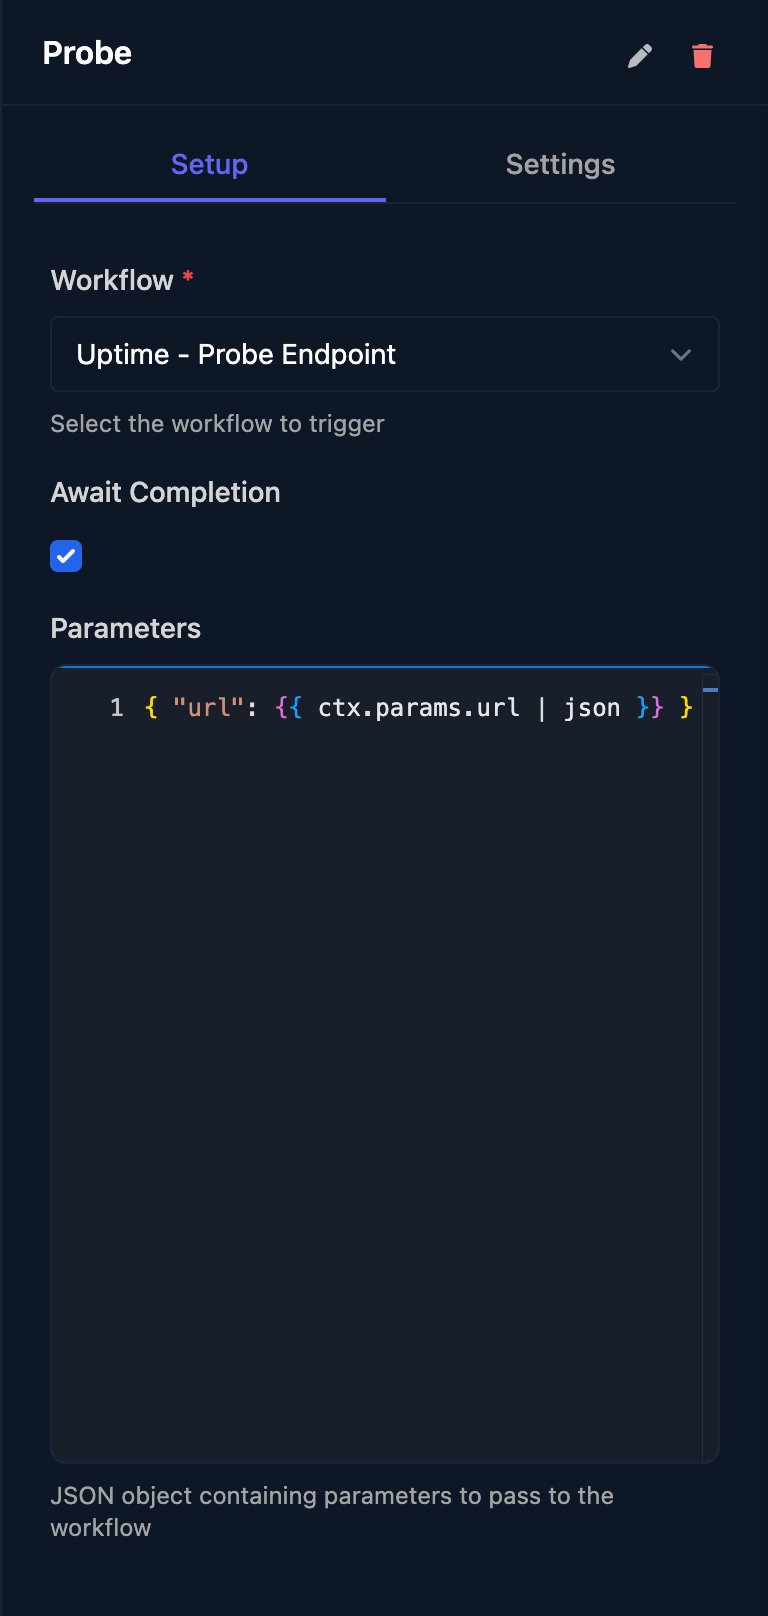
Click Probe and choose Uptime - Probe Endpoint as its Workflow, click Save Result and choose your database, change To on Down Alert and Recovery Alert to your service desk’s address, then click Save.
The Probe step: Workflow Uptime - Probe Endpoint, Await Completion ticked, and Parameters passing url from ctx.params.url with the json filter.
Evaluate counts a status from 200 to 399 as up and the second failure in a row as down; Needs Alert only emails on a change. To alert on the first failure, change failures >= 2 to failures >= 1 in Evaluate.
5

Import Uptime - Dispatch Checks

Import this.
Uptime - Dispatch Checks
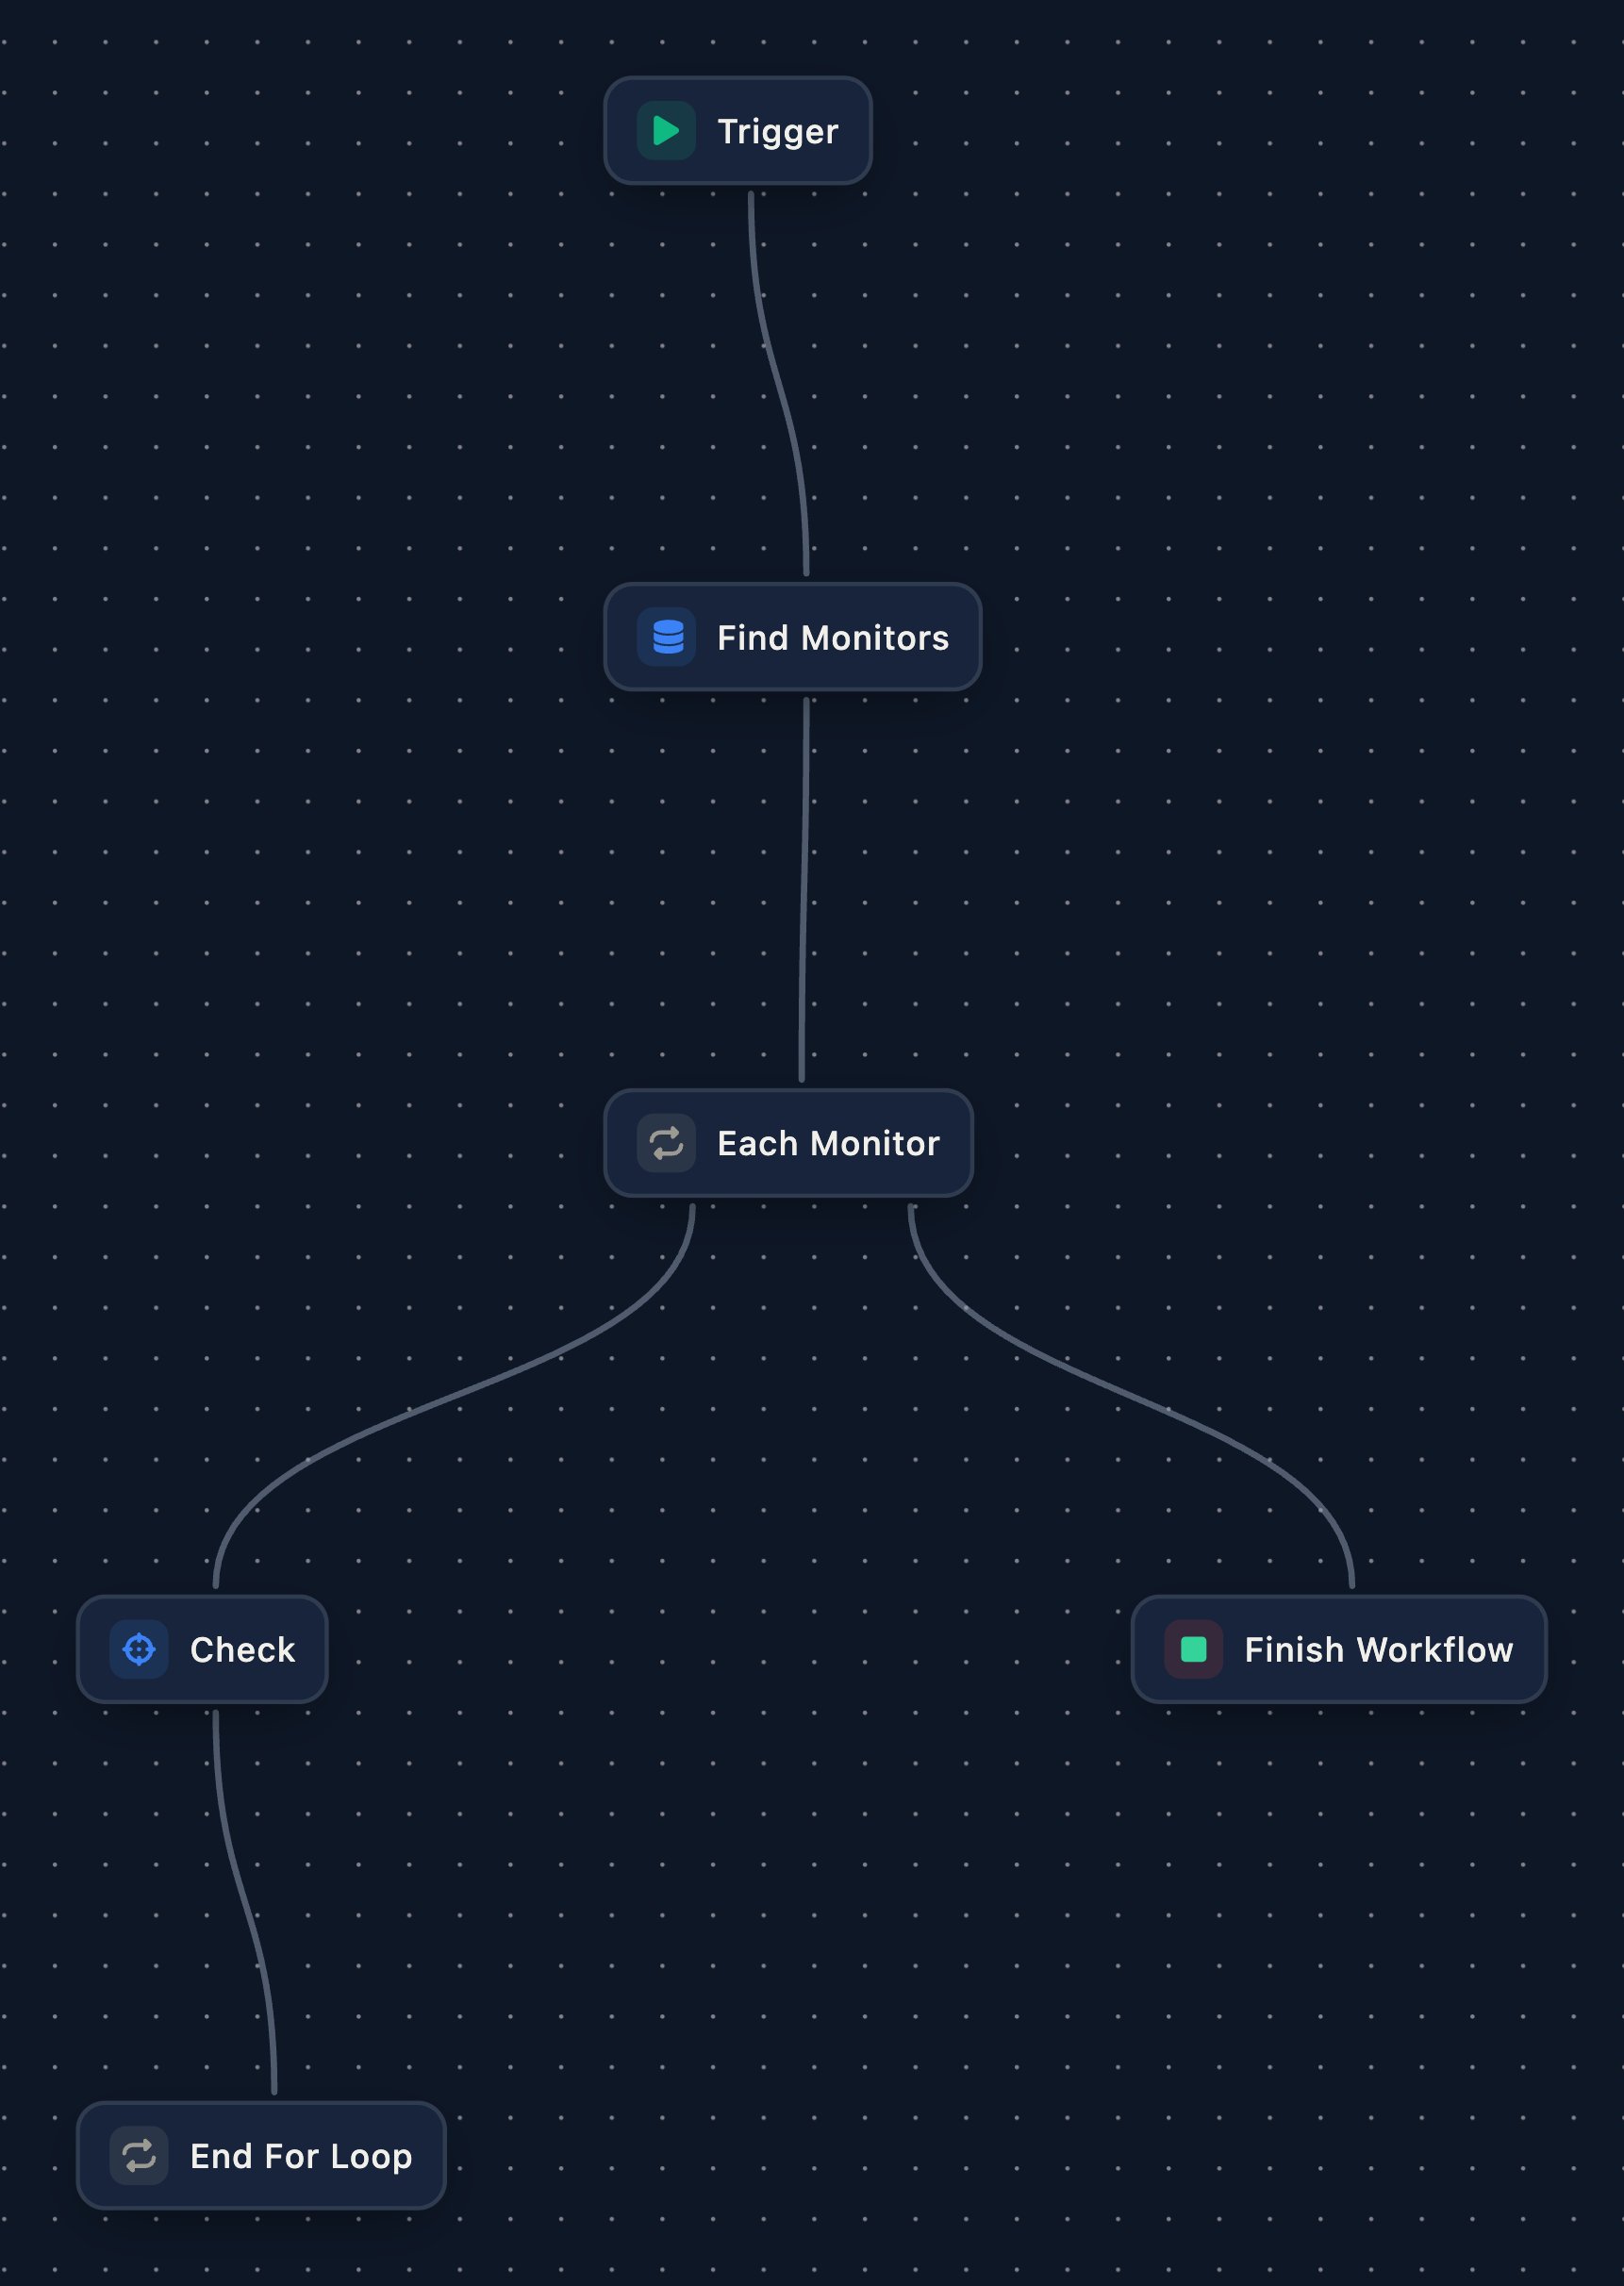
A workflow canvas: Trigger, Find Monitors, then an Each Monitor loop whose body runs Check and End For Loop, and whose completion leads to Finish Workflow.

Uptime - Dispatch Checks after import.
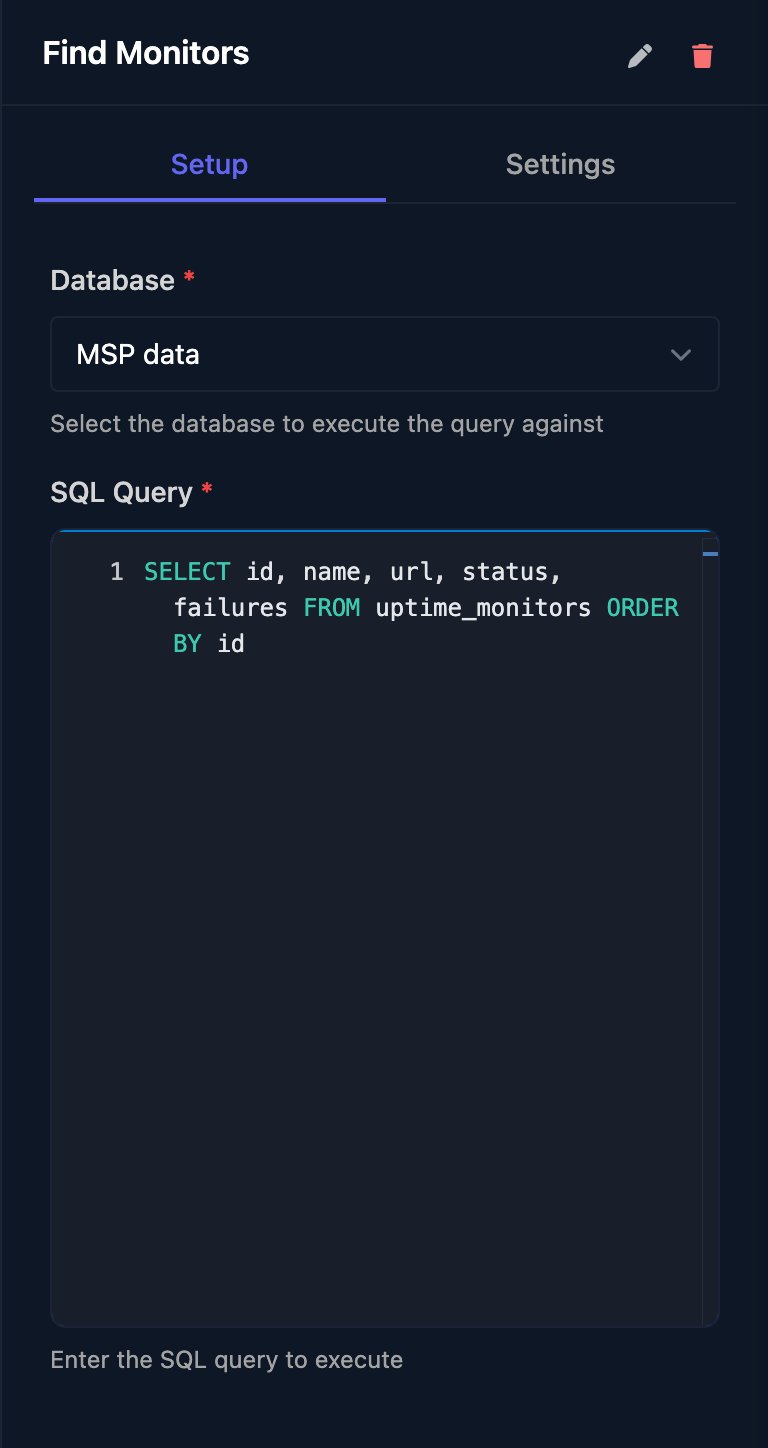
Click Find Monitors and choose your database, click Check and choose Uptime - Check Monitor as its Workflow, then click Save. You’ll add its schedule once you’ve tested it.
The Find Monitors Execute SQL step: Database MSP data and a SQL Query selecting id, name, url, status and failures from uptime_monitors ordered by id.
6

Import Uptime - Status

Import this, click Load Status, choose your database and click Save. Its Trigger already holds a Webhook trigger.
Uptime - Status
It returns each monitor’s name, status, 30-day uptime, last check and last error as JSON, without the URLs: anyone with a webhook’s URL can run it and read what it returns.
7

Add the app page

In Internal Apps, click New App, name it Uptime and click Create App. Click Design on its row, click Add Page, name it Status and click Create Page.Paste this page and replace STATUS_WORKFLOW_ID and DISPATCH_WORKFLOW_ID with the IDs of Uptime - Status and Uptime - Dispatch Checks, from each workflow’s address in Studio (app.triggr-app.com/workflows/<id>/design). Click Save, then Preview.
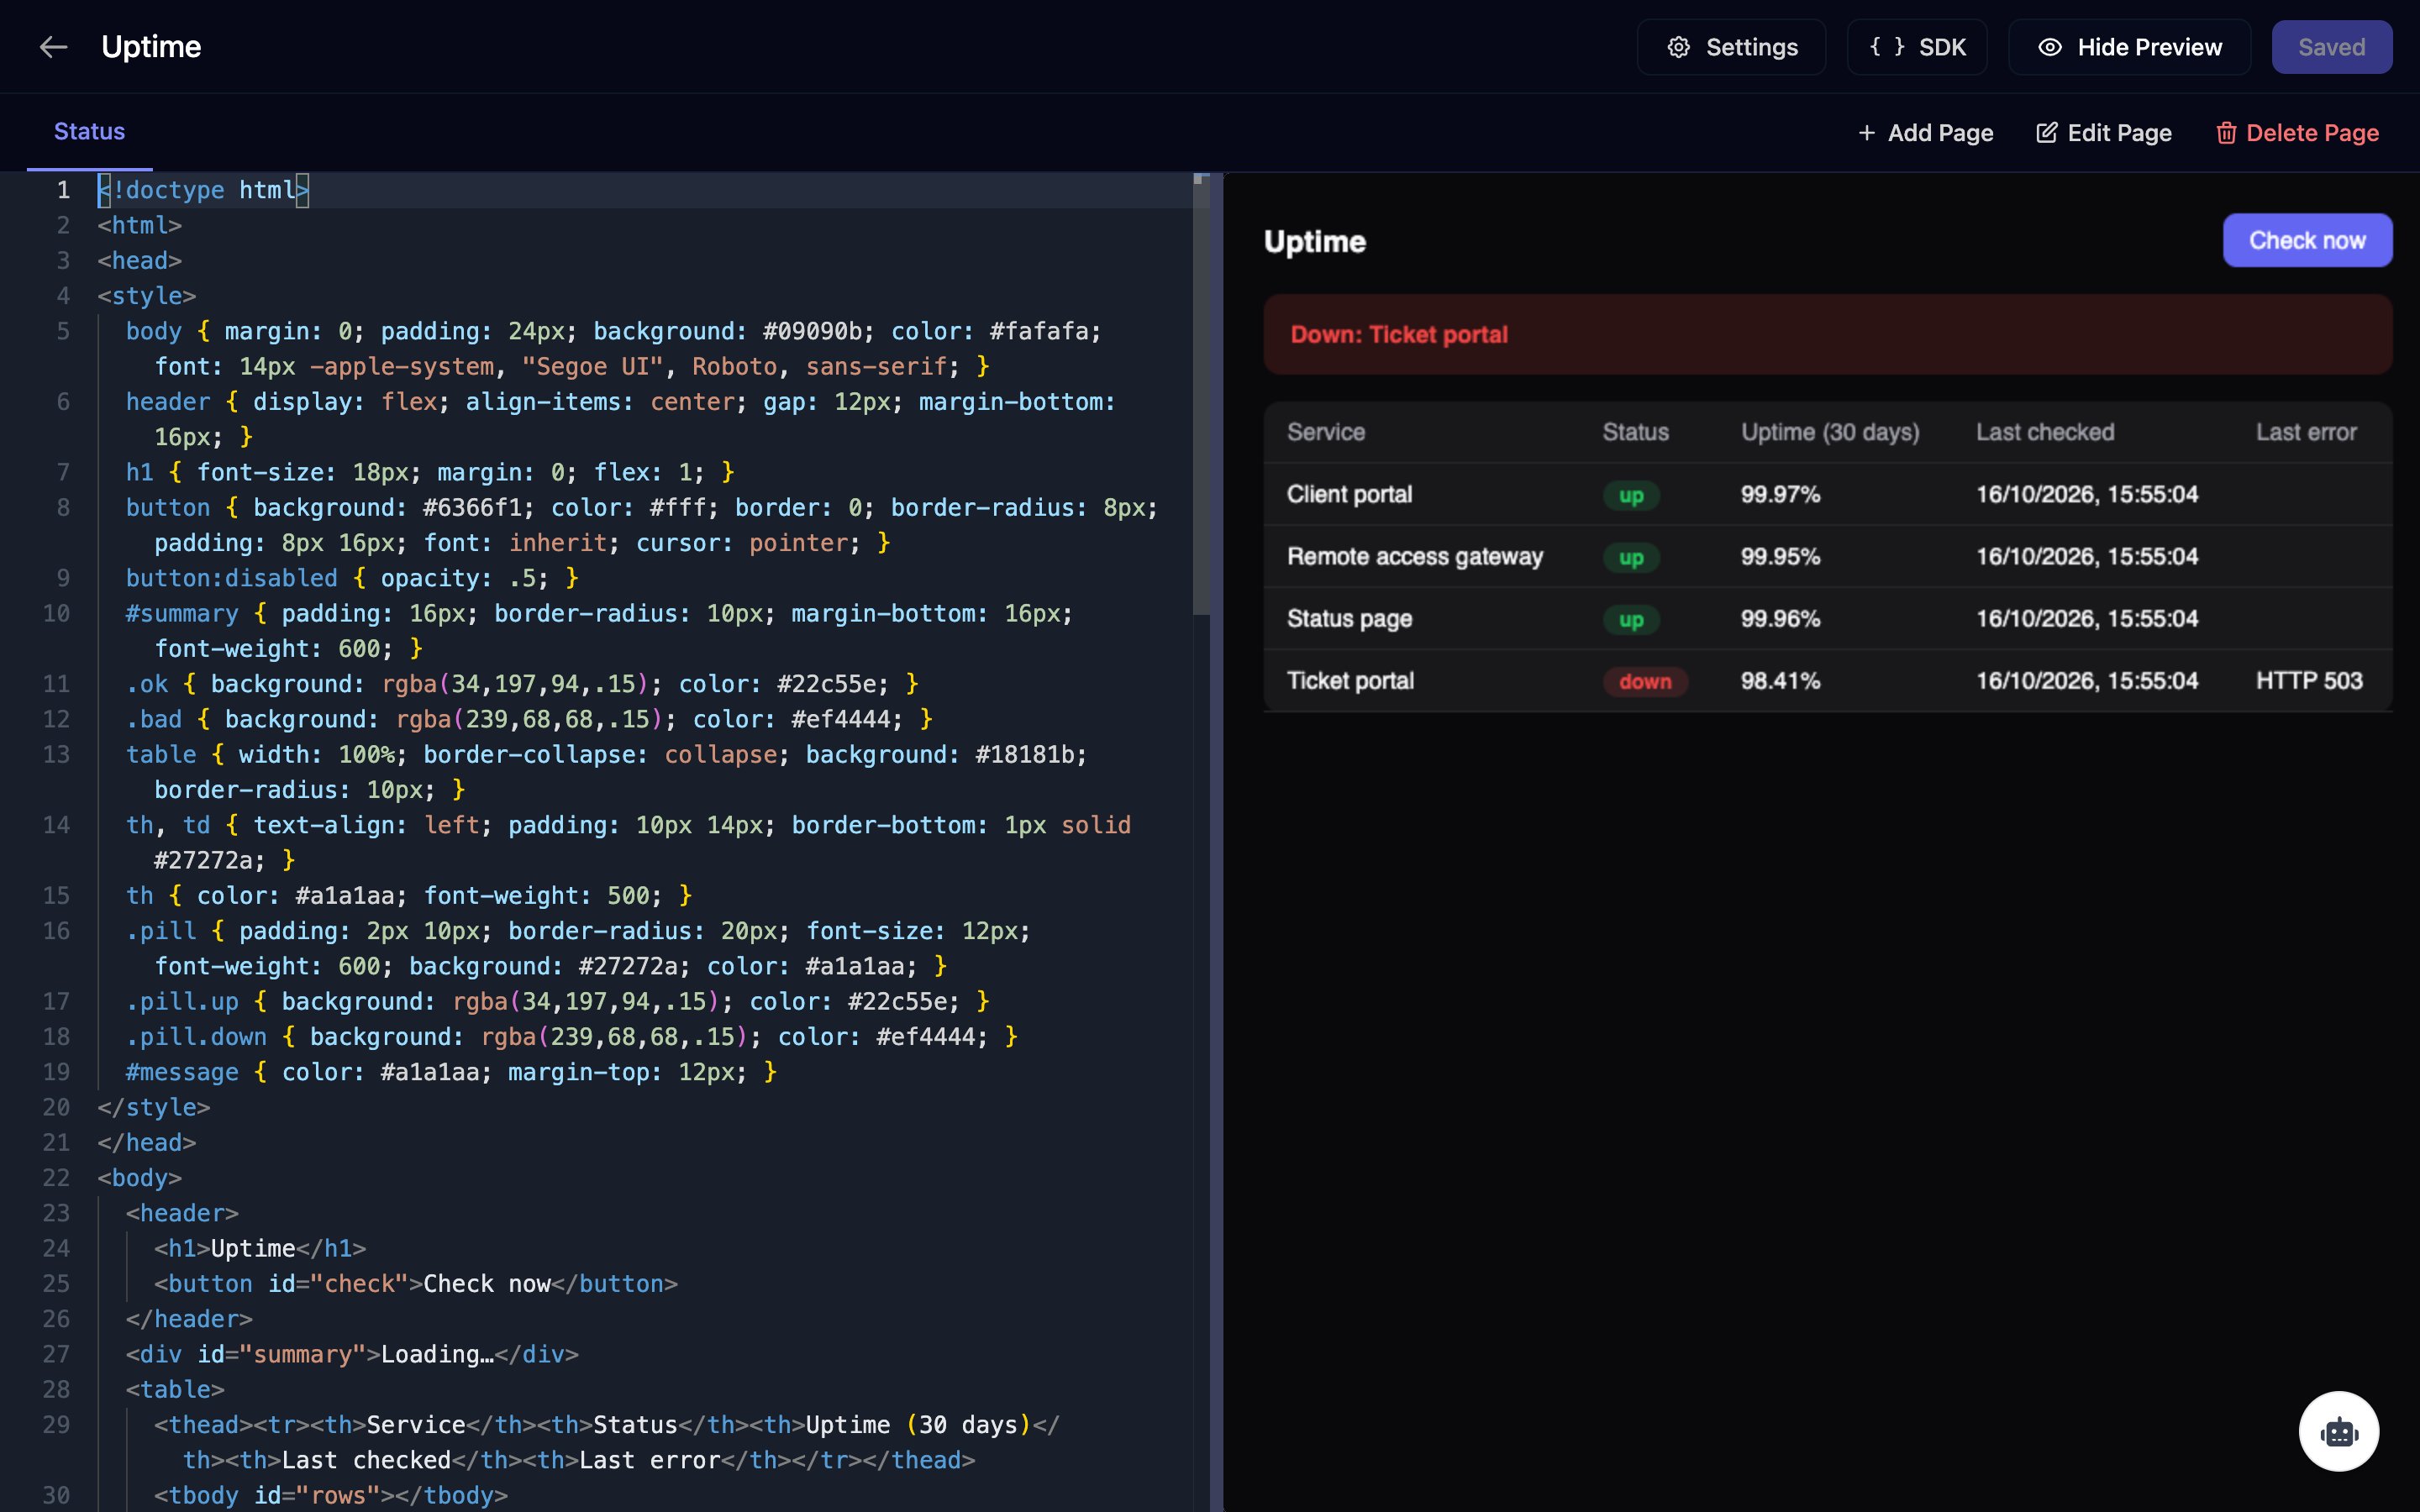
Status page
The Uptime app editor with the Status page's HTML on the left and a preview on the right: an Uptime heading with a Check now button, a red banner reading Down: Ticket portal, and a table of Client portal, Remote access gateway, Status page and Ticket portal with status pills, 30-day uptime, last checked time and the last error HTTP 503.

Preview loads the table from Uptime - Status.

8

Let the page start sweeps

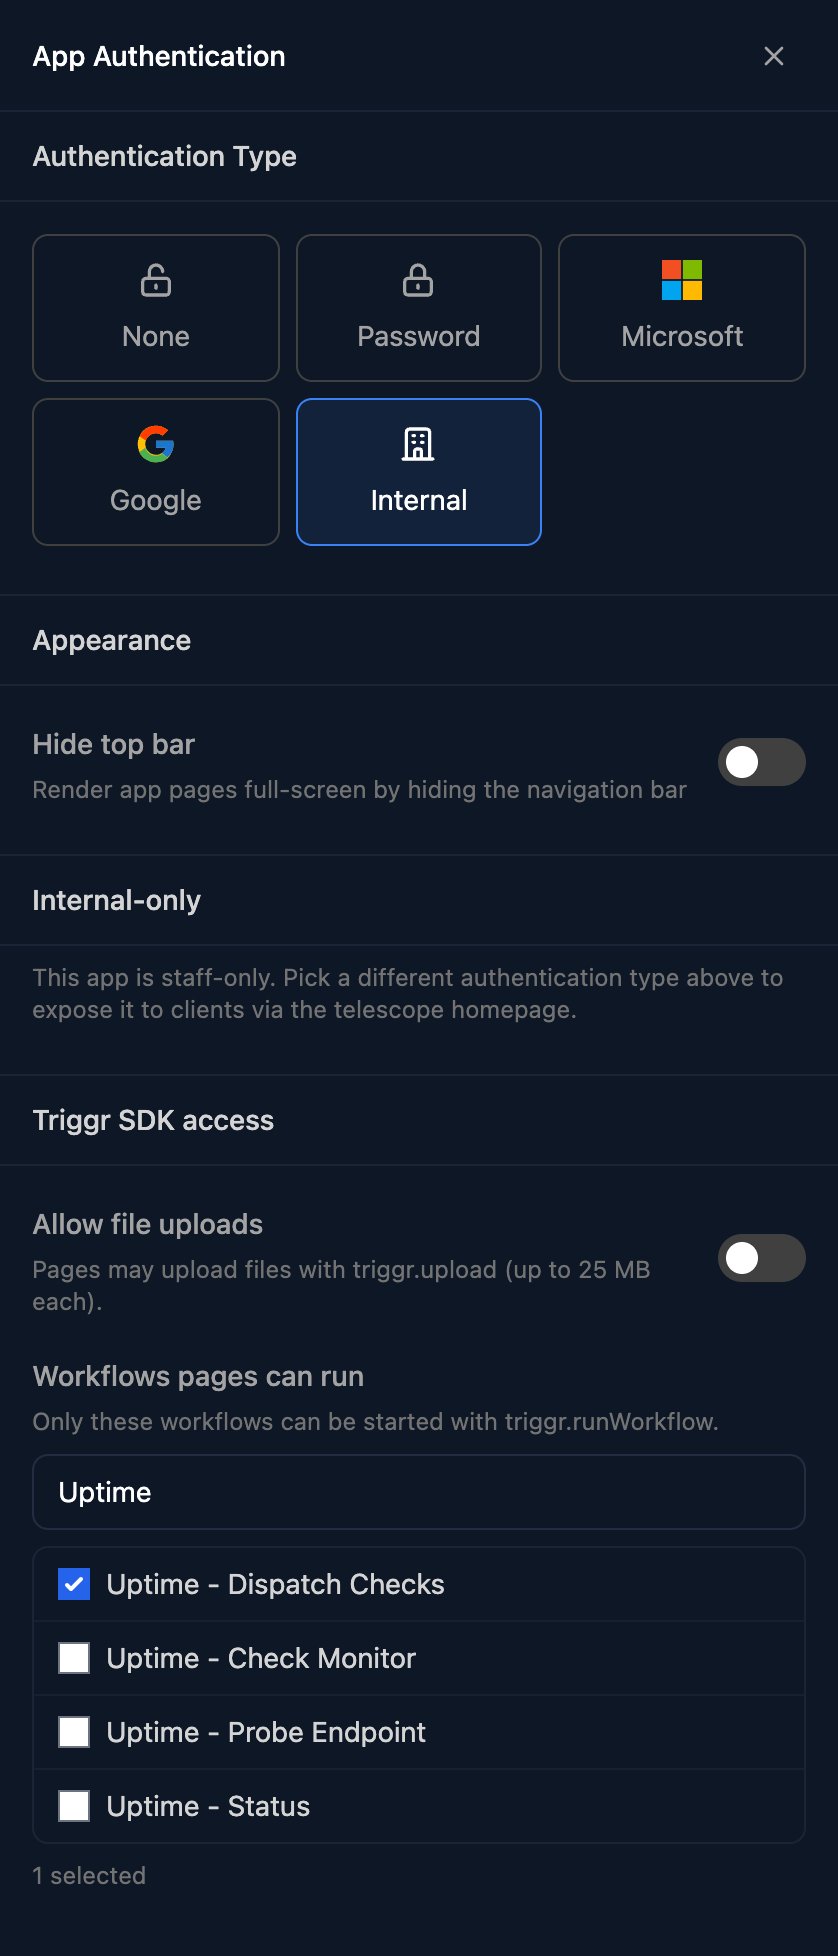
Click Settings, leave Authentication Type as Internal, tick Uptime - Dispatch Checks under Workflows pages can run and click Save Settings.
The App Authentication panel with Internal selected, Hide top bar off, an Internal-only note that the app is staff-only, Allow file uploads off, and Uptime - Dispatch Checks ticked under Workflows pages can run above Uptime - Check Monitor, Uptime - Probe Endpoint and Uptime - Status.
Your team opens the live app at https://app.triggr-app.com/telescope/apps/<org-id>/<app-id> with their staff sign-in (Support > Copy Org ID in the top bar gives the first ID; the second is in the designer’s address bar). Open on Internal Apps shows the page without the SDK, so Check now only works on that link.

Test it

1

Probe a URL

Open Uptime - Probe Endpoint, click Manual Trigger, enter { "url": "https://www.example.com" } and click Trigger Workflow. In the run, Finish Workflow’s output has comment: "200".
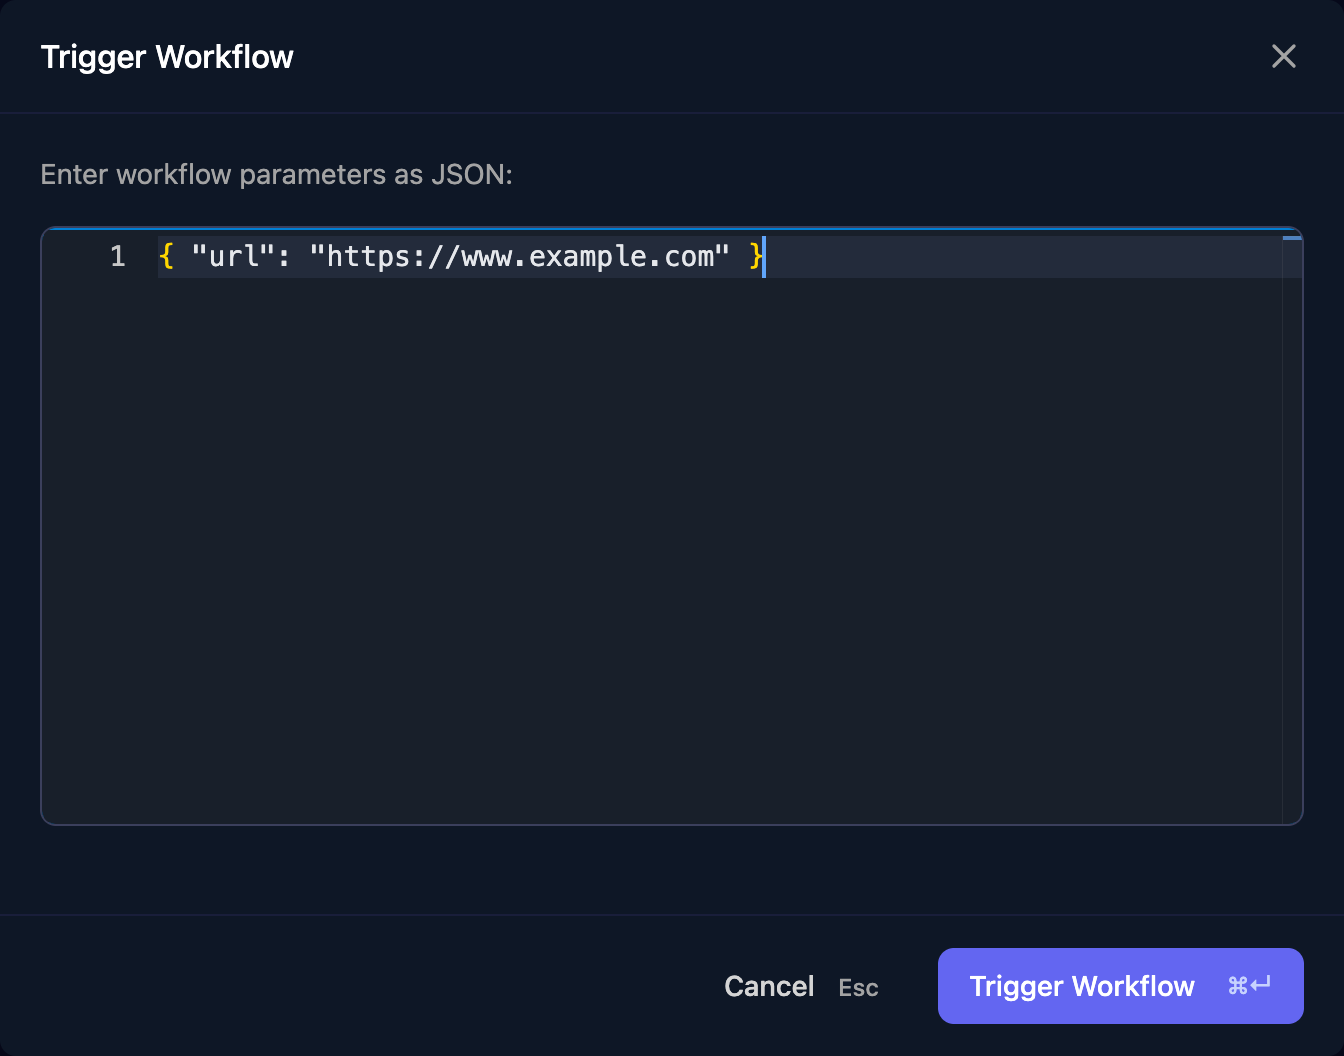
The Trigger Workflow dialog with the JSON url https://www.example.com entered, and Cancel and Trigger Workflow buttons.
2

Check one monitor

Open Uptime - Check Monitor and trigger it with the first monitor’s row:
The run reaches Finish Workflow without sending an email, and that monitor’s status in your database is now up.
3

Run a sweep from the app

Open the live app link from the last build step and click Check now. The page refreshes 30 seconds later, and Uptime - Check Monitor’s Runs has one run per monitor.
4

Test an alert

Add a monitor that can’t answer, click Check now, wait for the page to refresh and click it again. The second failure marks Alert test down and emails DOWN: Alert test.
Then delete it: DELETE FROM uptime_monitors WHERE name = 'Alert test';

Go live

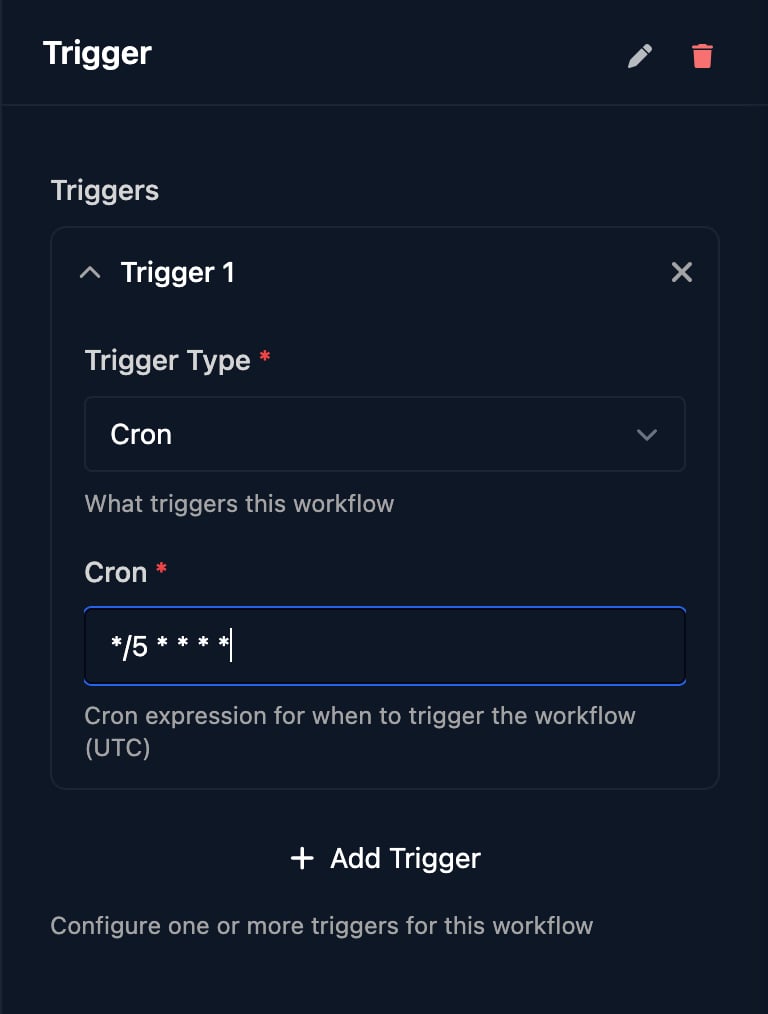
Open Uptime - Dispatch Checks, click Trigger, then Add Trigger, set Trigger Type to Cron, enter */5 * * * * and click Save.
The Trigger panel with Trigger 1 expanded: Trigger Type Cron and Cron set to */5 * * * *, with the hint Cron expression for when to trigger the workflow (UTC), and an Add Trigger button.
Check all four workflows show Active on Workflows (imports start Active). Add a row to uptime_monitors for each site to watch, and the next sweep picks it up.

FAQ

No. Scheduled runs are at least five minutes apart.
Each sweep is one Uptime - Dispatch Checks run plus a check and a probe per monitor (21 runs for 10 monitors), and the page adds an Uptime - Status run each time it loads.
Add a workflow with a Cron trigger such as 15 3 * * * and an Execute SQL step that runs DELETE FROM uptime_checks WHERE checked_at < now() - interval '90 days'.
No. Requests come from Triggr’s servers, so each URL must be reachable from the internet; a site with an allow list needs Triggr’s IP addresses.
Not as built: every client would see every monitor. Keep it Internal, or build a page per client with its own Status workflow.

Troubleshooting

Click Edit on the connection and type the password into Password; a connection string needs @, : and / encoded.
Triggr checks each query with EXPLAIN first, so statements such as CREATE TABLE fail. Create tables in your database’s own SQL editor.
The pasted JSON didn’t start with a top-level "id". Import the JSON from this page again.
Check the two IDs in the page, that Uptime - Status is saved with its Webhook trigger, and that Uptime - Dispatch Checks is ticked under Workflows pages can run.
You opened the page with Open. Use the live app link from the last build step.
It hasn’t been checked yet, or has failed once and not been up since; its last_error column says why.